We have to live withtools that produce inconsistent dumps. For example, LiveKd.exe from sysinternals.com which is widely used by Microsoft and Citrix technical support to save complete memory dumps without server reboot. I even wrote an article for Citrix customers:
Using LiveKD to Save a Complete Memory Dump for Session or System Hangs
If you read it you will find an important note which is reproduced here:
LiveKd.exe-generated dumps are always inconsistent and cannot be a reliable source for certain types of dump analysis, for example, looking at resource contention. This is because it takes a considerable amount of time to save a dump on a live system and the system is being changed during that process. The instantaneous traditional “CrashOnCtrlScroll” method or SystemDump tool always save a reliable and consistent dump because the system is frozen first (any process or kernel activity is disabled), then a dump is saved to a page file.
If you look at such inconsistent dump you will find thatmanyuseful kernelstructures such as ERESOURCE list (!locks)arebroken and even circular referenced and therefore WinDbg commands display “strange” output.
Easy and painless (for customers) dump generationusing such “Live” tools means thatit iswidely used and wehaveto analyze dumps saved bythese tools and sentfrom customers.This brings us to the next crash dump analysis pattern called “Inconsistent Dump”.
Ifyou have such dumpyou should look at itin order to extract maximum useful informationthat helpsin identifyingthe root cause or give you further directions. Not all information is inconsistent in such dumps. For example, drivers, processes, thread stacks and IRP lists cangive you some clues about activities. Even some information not visible in consistent dump can surface in inconsistent dump (subject to commands used).
For example, I had a LiveKd dump where I looked atprocess stacks by running the script I created earlier:
and I found that for some processesin addition to their own threadsthe script lists additional terminated threads that belong to a completely different process (have never seenit in consistent dump):

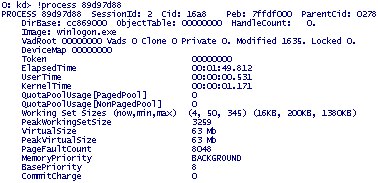
Process 89d97d88 is not visible in theactive process list (script mentioned above or !process 0 0 command). However, if wefeed thismemory address to !process command (or explore it as _EPROCESS structure, dt command) we getits contents:

What might have happened there: terminated process 89d97d88 was excluded from active processes list butitsstructure was left in memory and due to inconsistencythread listswere also brokenand therefore terminated threadssurfacedwhen listing other processes and their threads.
I suspected herethat winlogon.exe died in session 2 and left empty desktop windowwhich a customersaw and complained about. The only left and visible process from session 2 was csrss.exe. The conclusion was to enable NTSD as a default postmortem debugger to catch winlogon.exe crash when it happens next time.
- Dmitry Vostokov -
'Crash dump 불펌스페샬' 카테고리의 다른 글
| Crash Dump Analysis Patterns (Part 8) (0) | 2007.05.13 |
|---|---|
| Crash Dump Analysis Patterns (Part 6) (0) | 2007.05.13 |
| Crash Dump Analysis Patterns (Part 4) (0) | 2007.05.13 |
| Crash Dump Analysis Patterns (Part 5) (1) | 2007.05.13 |
| Crash Dump Analysis Patterns (Part 3) (2) | 2007.05.13 |


