Today I will talk about another patternoccurring frequently andI call itHidden Exception. Yourun !analyze -v command and you don’t seeanexception or you see only a breakpoint hit.In thiscase manual analysis is required.This happens sometimes because of another pattern: Multiple Exceptions. In other casesan exception happens and it is handled by an exception handler dismissing it and a process continues execution slowly accumulating corruption inside its data leading to a new crash or hang. Sometimesyou see a process hanging during its termination like the case I present here.
We have a process dumpwith onlyone thread:
0:000> kv
ChildEBP RetAddr
0096fcdc 7c822124 ntdll!KiFastSystemCallRet
0096fce0 77e6baa8 ntdll!NtWaitForSingleObject+0xc
0096fd50 77e6ba12 kernel32!WaitForSingleObjectEx+0xac
0096fd64 67f016ce kernel32!WaitForSingleObject+0x12
0096fd78 7c82257a component!DllInitialize+0xc2
0096fd98 7c8118b0 ntdll!LdrpCallInitRoutine+0x14
0096fe34 77e52fea ntdll!LdrShutdownProcess+0x130
0096ff20 77e5304d kernel32!_ExitProcess+0x43
0096ff34 77bcade4 kernel32!ExitProcess+0x14
0096ff40 77bcaefb msvcrt!__crtExitProcess+0x32
0096ff70 77bcaf6d msvcrt!_cinit+0xd2
0096ff84 77bcb555 msvcrt!_exit+0x11
0096ffb8 77e66063 msvcrt!_endthreadex+0xc8
0096ffec 00000000 kernel32!BaseThreadStart+0x34
We can look at its raw stack and try to find the following address:
KiUserExceptionDispatcher
This functioncalls RtlDispatchException:
0:000> !teb
TEB at 7ffdc000
 ExceptionList: 0096fd40
 StackBase: 00970000
 StackLimit: 0096a000
 SubSystemTib: 00000000
 FiberData: 00001e00
 ArbitraryUserPointer: 00000000
 Self: 7ffdc000
 EnvironmentPointer: 00000000
 ClientId: 00000858 . 000008c0
 RpcHandle: 00000000
 Tls Storage: 00000000
 PEB Address: 7ffdd000
 LastErrorValue: 0
 LastStatusValue: c0000135
 Count Owned Locks: 0
 HardErrorMode: 0
0:000>dds 0096a000 00970000
...
...
...
0096c770 7c8140cc ntdll!RtlDispatchException+0x91
0096c774 0096c808
0096c778 0096ffa8
0096c77c 0096c824
0096c780 0096c7e4
0096c784 77bc6c74 msvcrt!_except_handler3
0096c788 00000000
0096c78c 0096c808
0096c790 01030064
0096c794 00000000
0096c798 00000000
0096c79c 00000000
0096c7a0 00000000
0096c7a4 00000000
0096c7a8 00000000
0096c7ac 00000000
0096c7b0 00000000
0096c7b4 00000000
0096c7b8 00000000
0096c7bc 00000000
0096c7c0 00000000
0096c7c4 00000000
0096c7c8 00000000
0096c7cc 00000000
0096c7d0 00000000
0096c7d4 00000000
0096c7d8 00000000
0096c7dc 00000000
0096c7e0 00000000
0096c7e4 00000000
0096c7e8 00970000
0096c7ec 00000000
0096c7f0 0096caf0
0096c7f4 7c82ecc6 ntdll!KiUserExceptionDispatcher+0xe
0096c7f8 0096c000
0096c7fc 0096c824 ; a pointer to an exception context
0096c800 0096c808
0096c804 0096c824
0096c808 c0000005
0096c80c 00000000
0096c810 00000000
0096c814 77bd8df3 msvcrt!wcschr+0×15
0096c818 00000002
0096c81c 00000000
0096c820 01031000
0096c824 0001003f
0096c828 00000000
0096c82c 00000000
0096c830 00000000
0096c834 00000000
0096c838 00000000
0096c83c 00000000
A second parameter to both functions is a pointer to a so called exception context (processor state when an exception occurred). We can use .cxr command to change thread execution context to what it was at the time of exception:

Afterchanging the contextwe can see thread stack prior to that exception:
0:000> kL
ChildEBP RetAddr
0096caf0 67b11808 msvcrt!wcschr+0×15
0096cb10 67b1194d component2!function1+0×50
0096cb24 67b11afb component2!function2+0×1a
0096eb5c 67b11e10 component2!function3+0×39
0096ed94 67b14426 component2!function4+0×155
0096fdc0 67b164b7 component2!function5+0×3b
0096fdcc 00402831 component2!function6+0×5b
0096feec 0096ff14 program!function+0×1d1
0096ffec 00000000 kernel32!BaseThreadStart+0×34
We seethat the exception happened when component2 was searchinga Unicode string fora character (wcschr).Most likely the string was not zero terminated:

To summarize andshow youthe commonexception handling pathin user space here is another thread stack taken froma different dump:
ntdll!KiFastSystemCallRet
ntdll!NtWaitForMultipleObjects+0xc
kernel32!UnhandledExceptionFilter+0×746
kernel32!_except_handler3+0×61
ntdll!ExecuteHandler2+0×26
ntdll!ExecuteHandler+0×24
ntdll!RtlDispatchException+0×91
ntdll!KiUserExceptionDispatcher+0xe
ntdll!RtlpCoalesceFreeBlocks+0×36e ; crash is here
ntdll!RtlFreeHeap+0×38e
msvcrt!free+0xc3
msvcrt!_freefls+0×124
msvcrt!_freeptd+0×27
msvcrt!__CRTDLL_INIT+0×1da
ntdll!LdrpCallInitRoutine+0×14
ntdll!LdrShutdownThread+0xd2
kernel32!ExitThread+0×2f
kernel32!BaseThreadStart+0×39
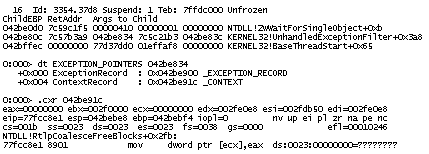
When RtlpCoalesceFreeBlocks(this function compacts heap and it is called from RtlFreeHeap)does an illegal memory access then this exception is first processed in kernel and becauseit happened in user space and mode the execution is transferred to RtlDispatchException which searches for exception handler and in this case there is a default one installed: UnhandledExceptionFilter.
If you see this function on call stack you can alsomanually get an exception context and a thread stackleading to it like in this example below taken fromother dump:

The most likely reasonofthis crashisan instance of Dynamic Memory Corruptionpattern - heap corruption.
- Dmitry Vostokov -
'Crash dump 불펌스페샬' 카테고리의 다른 글
| Crash Dump Analysis Patterns (Part 11) (4) | 2007.05.14 |
|---|---|
| Crash Dump Analysis Patterns (Part 9a) (2) | 2007.05.14 |
| Crash Dump Analysis Patterns (Part 6) (0) | 2007.05.13 |
| Crash Dump Analysis Patterns (Part 7) (2) | 2007.05.13 |
| Crash Dump Analysis Patterns (Part 4) (0) | 2007.05.13 |


