반응형
Crash Dump Analysis Patterns (Part 14)

The next pattern is Spiking Thread. If you have a process dump with many threads from a customer it is sometimes difficult to see which thread there was spiking CPU, that’s why it is always good to have some screenshots or notes from QSlice or Process Explorer showing spiking thread ID and process ID. The latter ID is to make sure that the process dump was from the correct process. New process dumpers and tools from Microsoft (userdump.exe, for example) save thread time information so you can open the dump and see the time spent in kernel and user mode for any thread by entering !runaway command. However if that command shows many threads with similar CPU consumption it will not highlight the particular thread that was spiking at the time the crash dump was saved so screenshots are still useful in some cases.

What to do if you don’t have spiking thread ID? Look at all threads and find those that are not waiting. Almost all threads are waiting most of the time. So the chances to dump the normal process and see some active threads are very low. If the thread is waiting the top function on its stack usually is (for XP/W2K3/Vista):

ntdll!KiFastSystemCallRet

and below it you could see some blocking calls waiting for some synchronization object, Sleep API call, IO completeion or for LPC reply:

0:085> ~*kv
...
...
...
64 Id: 1b0.120c Suspend: -1 Teb: 7ff69000 Unfrozen
ChildEBP RetAddr Args to Child
02defe18 7c90e399 ntdll!KiFastSystemCallRet
02defe1c 77e76703 ntdll!NtReplyWaitReceivePortEx+0xc
02deff80 77e76c22 rpcrt4!LRPC_ADDRESS::ReceiveLotsaCalls+0xf4
02deff88 77e76a3b rpcrt4!RecvLotsaCallsWrapper+0xd
02deffa8 77e76c0a rpcrt4!BaseCachedThreadRoutine+0×79
02deffb4 7c80b683 rpcrt4!ThreadStartRoutine+0×1a
02deffec 00000000 kernel32!BaseThreadStart+0×37

65 Id: 1b0.740 Suspend: -1 Teb: 7ff67000 Unfrozen
ChildEBP RetAddr Args to Child
02edff44 7c90d85c ntdll!KiFastSystemCallRet
02edff48 7c8023ed ntdll!NtDelayExecution+0xc
02edffa0 57cde2dd kernel32!SleepEx+0×61

02edffb4 7c80b683 component!foo+0×35
02edffec 00000000 kernel32!BaseThreadStart+0×37

66 Id: 1b0.131c Suspend: -1 Teb: 7ff66000 Unfrozen
ChildEBP RetAddr Args to Child
02f4ff38 7c90e9c0 ntdll!KiFastSystemCallRet
02f4ff3c 7c8025cb ntdll!ZwWaitForSingleObject+0xc
02f4ffa0 72001f65 kernel32!WaitForSingleObjectEx+0xa8

02f4ffb4 7c80b683 component!WorkerThread+0×15
02f4ffec 00000000 kernel32!BaseThreadStart+0×37

67 Id: 1b0.1320 Suspend: -1 Teb: 7ff65000 Unfrozen
ChildEBP RetAddr Args to Child
02f8fe1c 7c90e9ab ntdll!KiFastSystemCallRet
02f8fe20 7c8094e2 ntdll!ZwWaitForMultipleObjects+0xc
02f8febc 7e4195f9 kernel32!WaitForMultipleObjectsEx+0×12c
02f8ff18 7e4196a8 user32!RealMsgWaitForMultipleObjectsEx+0×13e
02f8ff34 720019f6 user32!MsgWaitForMultipleObjects+0×1f

02f8ffa0 72001a29 component!bar+0xd9
02f8ffb4 7c80b683 component!MonitorWorkerThread+0×11
02f8ffec 00000000 kernel32!BaseThreadStart+0×37

68 Id: 1b0.1340 Suspend: -1 Teb: 7ff63000 Unfrozen
ChildEBP RetAddr Args to Child
0301ff1c 7c90e31b ntdll!KiFastSystemCallRet
0301ff20 7c80a746 ntdll!ZwRemoveIoCompletion+0xc
0301ff4c 57d46e65 kernel32!GetQueuedCompletionStatus+0×29

0301ffb4 7c80b683 component!AsyncEventsThread+0×91
0301ffec 00000000 kernel32!BaseThreadStart+0×37


# 85 Id: 1b0.17b4 Suspend: -1 Teb: 7ffd4000 Unfrozen
ChildEBP RetAddr Args to Child
00daffc8 7c9507a8 ntdll!DbgBreakPoint
00dafff4 00000000 ntdll!DbgUiRemoteBreakin+0×2d

Therefore if you have a different thread like this one below the chances that it was spiking are big:

58 Id: 1b0.9f4 Suspend: -1 Teb: 7ff75000 Unfrozen
ChildEBP RetAddr Args to Child
0280f64c 500af723 componentB!DoSomething+32
0280f85c 500b5391 componentB!CheckSomething+231
0280f884 500b7a3f componentB!ProcessWorkIteme+9f
0301ffec 00000000 kernel32!BaseThreadStart+0x37

There is no KiFastSystemCallRet on top and if we look at the currently executing instruction it indeed does some copy operation:

0:085> ~58r
eax=00000000 ebx=0280fdd4 ecx=0000005f edx=00000000 esi=03d30444 edi=0280f6dc
eip=500a4024 esp=0280f644 ebp=0280f64c iopl=0 nv up ei pl nz na po nc
cs=001b ss=0023 ds=0023 es=0023 fs=003b gs=0000 efl=00010202
wuaueng!DllRegisterServer+0x5b32:
500a4024 f3a5 rep movs dword ptr es:[edi],dword ptr [esi] es:0023:0280f6dc=00000409 ds:0023:03d30444=00000409

In a kernel or a complete memory dump you can see spikes by checking KernelTime and UserTime:

0: kd> !thread 88b66768
THREAD 88b66768 Cid 01fc.1550 Teb: 7ffad000 Win32Thread: bc18f240 RUNNING on processor 1
IRP List:
89716008: (0006,0094) Flags: 00000a00 Mdl: 00000000
Impersonation token: e423a030 (Level Impersonation)
DeviceMap e3712480
Owning Process 8a0a56a0 Image: SomeSvc.exe
Wait Start TickCount 1782229 Ticks: 0
Context Switch Count 877610 LargeStack
UserTime 00:00:01.0078
KernelTime 02:23:21.0718

- Dmitry Vostokov -

반응형
반응형
Crash Dump Analysis Patterns (Part 5b)


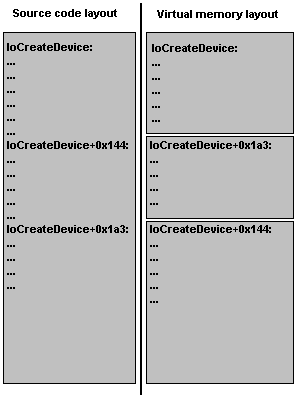
This is a follow up to Optimized Code patternwritten previously. Now I discuss the following feature that often bewilders beginners. It is called OMAP code optimization. It is used to make code that needs to be present in memory smaller. So instead of flat address space for compiled function you have pieces of it scattered here and there.This leads to an ambiguity when you try to disassembleOMAP code atits address because WinDbg doesn’t knowwhether it shouldtreat addressrange as a function offset (starting from the beginning ofthe function source code) or just a memory layout offset (starting from the address of that function). Let me illustrate this on IoCreateDevice function code.

Lets first evaluate a random address starting from the first address of the function (memory layoutoffset):

kd> ? nt!IoCreateDevice
Evaluate expression: -8796073668256 = fffff800`01275160
kd> ? nt!IoCreateDevice+0×144
Evaluate expression: -8796073667932 = fffff800`012752a4
kd> ? fffff800`012752a4-fffff800`01275160
Evaluate expression: 324 = 00000000`00000144

Ifwe try todisassemblecodeat the same addressthe expression will also be evaluated asthe memory layoutoffset:

kd> u nt!IoCreateDevice+0×144
nt!IoCreateDevice+0×1a3:
fffff800`012752a4 83c810 or eax,10h
fffff800`012752a7 898424b0000000 mov dword ptr [rsp+0B0h],eax
fffff800`012752ae 85ed test ebp,ebp
fffff800`012752b0 8bdd mov ebx,ebp
fffff800`012752b2 0f858123feff jne nt!IoCreateDevice+0×1b3
fffff800`012752b8 035c2454 add ebx,dword ptr [rsp+54h]
fffff800`012752bc 488b1585dcf2ff mov rdx,qword ptr [nt!IoDeviceObjectType]
fffff800`012752c3 488d8c2488000000 lea rcx,[rsp+88h]

You see the difference: we give +0×144 offset but the code is shown from +0×1a3! This is because OMAP optimization moved the code fromthe function offset +0×1a3 tomemory locations starting from +0×144. The following picture illustrates this:

If you see this when disassembling a function name+offset address from a thread stack trace you can useraw address instead:

kd> k
Child-SP RetAddr Call Site
fffffadf`e3a18d30 fffff800`012b331e component!function+0×72
fffffadf`e3a18d70 fffff800`01044196 nt!PspSystemThreadStartup+0×3e
fffffadf`e3a18dd0 00000000`00000000 nt!KxStartSystemThread+0×16
kd> u fffff800`012b331e
nt!PspSystemThreadStartup+0×3e:
fffff800`012b331e 90 nop
fffff800`012b331f f683fc03000040 test byte ptr [rbx+3FCh],40h
fffff800`012b3326 0f8515d30600 jne nt!PspSystemThreadStartup+0×4c
fffff800`012b332c 65488b042588010000 mov rax,qword ptr gs:[188h]
fffff800`012b3335 483bd8 cmp rbx,rax
fffff800`012b3338 0f85a6d30600 jne nt!PspSystemThreadStartup+0×10c
fffff800`012b333e 838bfc03000001 or dword ptr [rbx+3FCh],1
fffff800`012b3345 33c9 xor ecx,ecx

Youalso see OMAP in action also when you try to disassemblethe function body using uf command:

kd> uf nt!IoCreateDevice
nt!IoCreateDevice+0×34d:
fffff800`0123907d 834f3008 or dword ptr [rdi+30h],8
fffff800`01239081 e955c30300 jmp nt!IoCreateDevice+0×351


nt!IoCreateDevice+0×14c:
fffff800`0126f320 6641be0002 mov r14w,200h
fffff800`0126f325 e92f5f0000 jmp nt!IoCreateDevice+0×158
nt!IoCreateDevice+0×3cc:
fffff800`01270bd0 488d4750 lea rax,[rdi+50h]
fffff800`01270bd4 48894008 mov qword ptr [rax+8],rax
fffff800`01270bd8 488900 mov qword ptr [rax],rax
fffff800`01270bdb e95b480000 jmp nt!IoCreateDevice+0×3d7
nt!IoCreateDevice+0xa4:
fffff800`01273eb9 41b801000000 mov r8d,1
fffff800`01273ebf 488d154a010700 lea rdx,[nt!`string’]
fffff800`01273ec6 488d8c24d8000000 lea rcx,[rsp+0D8h]
fffff800`01273ece 440fc10522f0f2ff xadd dword ptr [nt!IopUniqueDeviceObjectNumber],r8d
fffff800`01273ed6 41ffc0 inc r8d
fffff800`01273ed9 e8d236deff call nt!swprintf
fffff800`01273ede 4584ed test r13b,r13b
fffff800`01273ee1 0f85c1a70800 jne nt!IoCreateDevice+0xce


- Dmitry Vostokov -

반응형
반응형
Crash Dump Analysis Patterns (Part 12)


Another pattern that happens so often in crash dumps: No Component Symbols. In this case we can guess whata component does by looking at its name,overall thread stackwhere it is called and also itsimport table. Here isan example. We have component.sys driver visible on some thread stack in a kernel dump but we don’t know whatthat component can potentiallydo. Because we don’t have symbols we cannot see its imported functions:

kd> x component!*
kd>

We use !dh command to dump its image headers:

kd> lmv m component
start end module name
fffffadf`e0eb5000 fffffadf`e0ebc000 component (no symbols)
Loaded symbol image file: component.sys
Image path: ??C:Componentx64component.sys
Image name: component.sys
Timestamp: Sat Jul 01 19:06:16 2006 (44A6B998)
CheckSum: 000074EF
ImageSize: 00007000
Translations: 0000.04b0 0000.04e0 0409.04b0 0409.04e0
kd> !dh fffffadf`e0eb5000
File Type: EXECUTABLE IMAGE
FILE HEADER VALUES
8664 machine (X64)
6 number of sections
44A6B998 time date stamp Sat Jul 01 19:06:16 2006
0 file pointer to symbol table
0 number of symbols
F0 size of optional header
22 characteristics
Executable
App can handle >2gb addresses
OPTIONAL HEADER VALUES
20B magic #
8.00 linker version
C00 size of code
A00 size of initialized data
0 size of uninitialized data
5100 address of entry point
1000 base of code
----- new -----
0000000000010000 image base
1000 section alignment
200 file alignment
1 subsystem (Native)
5.02 operating system version
5.02 image version
5.02 subsystem version
7000 size of image
400 size of headers
74EF checksum
0000000000040000 size of stack reserve
0000000000001000 size of stack commit
0000000000100000 size of heap reserve
0000000000001000 size of heap commit
0 [ 0] address [size] of Export Directory
51B0 [ 28] address [size] of Import Directory
6000 [ 3B8] address [size] of Resource Directory
4000 [ 6C] address [size] of Exception Directory
0 [ 0] address [size] of Security Directory
0 [ 0] address [size] of Base Relocation Directory
2090 [ 1C] address [size] of Debug Directory
0 [ 0] address [size] of Description Directory
0 [ 0] address [size] of Special Directory
0 [ 0] address [size] of Thread Storage Directory
0 [ 0] address [size] of Load Configuration Directory
0 [ 0] address [size] of Bound Import Directory
2000 [ 88] address [size] of Import Address Table Directory
0 [ 0] address [size] of Delay Import Directory
0 [ 0] address [size] of COR20 Header Directory
0 [ 0] address [size] of Reserved Directory


Then we display the contents of Import Address Table Directory using dps command:

kd> dps fffffadf`e0eb5000+2000 fffffadf`e0eb5000+2000+88
fffffadf`e0eb7000 fffff800`01044370 nt!IoCompleteRequest
fffffadf`e0eb7008 fffff800`01019700 nt!IoDeleteDevice
fffffadf`e0eb7010 fffff800`012551a0 nt!IoDeleteSymbolicLink
fffffadf`e0eb7018 fffff800`01056a90 nt!MiResolveTransitionFault+0x7c2
fffffadf`e0eb7020 fffff800`0103a380 nt!ObDereferenceObject
fffffadf`e0eb7028 fffff800`0103ace0 nt!KeWaitForSingleObject
fffffadf`e0eb7030 fffff800`0103c570 nt!KeSetTimer
fffffadf`e0eb7038 fffff800`0102d070 nt!IoBuildPartialMdl+0x3
fffffadf`e0eb7040 fffff800`012d4480 nt!PsTerminateSystemThread
fffffadf`e0eb7048 fffff800`01041690 nt!KeBugCheckEx
fffffadf`e0eb7050 fffff800`010381b0 nt!KeInitializeTimer
fffffadf`e0eb7058 fffff800`0103ceb0 nt!ZwClose
fffffadf`e0eb7060 fffff800`012b39f0 nt!ObReferenceObjectByHandle
fffffadf`e0eb7068 fffff800`012b7380 nt!PsCreateSystemThread
fffffadf`e0eb7070 fffff800`01251f90 nt!FsRtlpIsDfsEnabled+0x114
fffffadf`e0eb7078 fffff800`01275160 nt!IoCreateDevice
fffffadf`e0eb7080 00000000`00000000
fffffadf`e0eb7088 00000000`00000000

We see that this driver under certain circumstances could bug check the system using KeBugCheckEx, it creates system thread(s) (PsCreateSystemThread) and uses timer(s) (KeInitializeTimer, KeSetTimer).

If you see name+offset in import table (I think this is an effect of OMAP code optimization) you can get the function by using ln command (list nearest symbols):

kd> ln fffff800`01056a90
(fffff800`01056760) nt!MiResolveTransitionFault+0x7c2 | (fffff800`01056a92) nt!RtlInitUnicodeString
kd> ln fffff800`01251f90
(fffff800`01251e90) nt!FsRtlpIsDfsEnabled+0×114 | (fffff800`01251f92) nt!IoCreateSymbolicLink

This technique is useful if you have a bugcheck that happens when a driver calls certain functions or must call certain function in pairs, like bugcheck 0×20:

kd> !analyze -show 0x20
KERNEL_APC_PENDING_DURING_EXIT (20)
The key data item is the thread's APC disable count. If this is non-zero, then this is the source of the problem. The APC disable count is decremented each time a driver calls KeEnterCriticalRegion, KeInitializeMutex, or FsRtlEnterFileSystem.The APC disable count is incremented each time a driver calls KeLeaveCriticalRegion, KeReleaseMutex, or FsRtlExitFileSystem. Since these calls should always be in pairs, this value should be zero when a thread exits.A negative value indicates that a driver has disabled APC calls without re-enabling them.A positive value indicates that the reverse is true. If you ever see this error, be very suspicious of all drivers installed on the machine — especially unusual or non-standard drivers.Third party file system redirectors are especially suspicious since they do not generally receive the heavy duty testing that NTFS, FAT, RDR, etc receive. This current IRQL should also be 0. If it is not, that a driver’s cancelation routine can cause this bugcheck by returning at an elevated IRQL. Always attempt to note what you were doing/closing at the time of the crash, and note all of the installed drivers at the time of the crash. This symptom is usually a severe bug in a third party driver.

Then you can see at least whether the suspicious driver could have potentially used those functions and if itimports one of them youcan see whether it imports the correspondingcounterpart function.

- Dmitry Vostokov -

반응형
반응형
Crash Dump Analysis Patterns (Part 10)

Sometimesthe change of operating system version or installing an intrusive product reveals hidden bugs in software that was working perfectly before that.

What have happened after installing the new software? If you look at the process dump you would see many DLLs loaded at their specific virtual addresses. Here is the output from lm WinDbg command after attaching to iexplore.exe process running on my Windows XP SP2 workstation:

0:000> lm
start end module name
00400000 00419000 iexplore
01c80000 01d08000 shdoclc
01d10000 01fd5000 xpsp2res
022b0000 022cd000 xpsp3res
02680000 02946000 msi
031f0000 031fd000 LvHook
03520000 03578000 PortableDeviceApi
037e0000 037f7000 odbcint
0ffd0000 0fff8000 rsaenh
20000000 20012000 browselc
30000000 302ee000 Flash9b
325c0000 325d2000 msohev
4d4f0000 4d548000 WINHTTP
5ad70000 5ada8000 UxTheme
5b860000 5b8b4000 NETAPI32
5d090000 5d12a000 comctl32_5d090000
5e310000 5e31c000 pngfilt
63000000 63014000 SynTPFcs
662b0000 66308000 hnetcfg
66880000 6688c000 ImgUtil
6bdd0000 6be06000 dxtrans
6be10000 6be6a000 dxtmsft
6d430000 6d43a000 ddrawex
71a50000 71a8f000 mswsock
71a90000 71a98000 wshtcpip
71aa0000 71aa8000 WS2HELP
71ab0000 71ac7000 WS2_32
71ad0000 71ad9000 wsock32
71b20000 71b32000 MPR
71bf0000 71c03000 SAMLIB
71c10000 71c1e000 ntlanman
71c80000 71c87000 NETRAP
71c90000 71cd0000 NETUI1
71cd0000 71ce7000 NETUI0
71d40000 71d5c000 actxprxy
722b0000 722b5000 sensapi
72d10000 72d18000 msacm32
72d20000 72d29000 wdmaud
73300000 73367000 vbscript
73760000 737a9000 DDRAW
73bc0000 73bc6000 DCIMAN32
73dd0000 73ece000 MFC42
74320000 7435d000 ODBC32
746c0000 746e7000 msls31
746f0000 7471a000 msimtf
74720000 7476b000 MSCTF
754d0000 75550000 CRYPTUI
75970000 75a67000 MSGINA
75c50000 75cbe000 jscript
75cf0000 75d81000 mlang
75e90000 75f40000 SXS
75f60000 75f67000 drprov
75f70000 75f79000 davclnt
75f80000 7607d000 BROWSEUI
76200000 76271000 mshtmled
76360000 76370000 WINSTA
76390000 763ad000 IMM32
763b0000 763f9000 comdlg32
76600000 7661d000 CSCDLL
767f0000 76817000 schannel
769c0000 76a73000 USERENV
76b20000 76b31000 ATL
76b40000 76b6d000 WINMM
76bf0000 76bfb000 PSAPI
76c30000 76c5e000 WINTRUST
76c90000 76cb8000 IMAGEHLP
76d60000 76d79000 iphlpapi
76e80000 76e8e000 rtutils
76e90000 76ea2000 rasman
76eb0000 76edf000 TAPI32
76ee0000 76f1c000 RASAPI32
76f20000 76f47000 DNSAPI
76f60000 76f8c000 WLDAP32
76fc0000 76fc6000 rasadhlp
76fd0000 7704f000 CLBCATQ
77050000 77115000 COMRes
77120000 771ac000 OLEAUT32
771b0000 77256000 WININET
773d0000 774d3000 comctl32
774e0000 7761d000 ole32
77920000 77a13000 SETUPAPI
77a20000 77a74000 cscui
77a80000 77b14000 CRYPT32
77b20000 77b32000 MSASN1
77b40000 77b62000 appHelp
77bd0000 77bd7000 midimap
77be0000 77bf5000 MSACM32_77be0000
77c00000 77c08000 VERSION
77c10000 77c68000 msvcrt
77c70000 77c93000 msv1_0
77d40000 77dd0000 USER32
77dd0000 77e6b000 ADVAPI32
77e70000 77f01000 RPCRT4
77f10000 77f57000 GDI32
77f60000 77fd6000 SHLWAPI
77fe0000 77ff1000 Secur32
7c800000 7c8f4000 kernel32
7c900000 7c9b0000 ntdll
7c9c0000 7d1d5000 SHELL32
7dc30000 7df20000 mshtml
7e1e0000 7e280000 urlmon
7e290000 7e3ff000 SHDOCVW

Installing or upgrading softwarecanchange the distribution of loaded DLLs and theiraddresses. This also happens when you installsome monitoring software which usually injectstheir DLLs into every process. As a result some DLLsmightbe relocated or even the new ones appear loaded. And this might influence 3rd-party program behavior therefore exposing its hidden bugs beingdormant when executing the process in old environment. I call this pattern Changed Environment.

Let’s look at some hypothetical example. Supposeyour program has the following code fragment

if (*p)
{
// do something useful
}

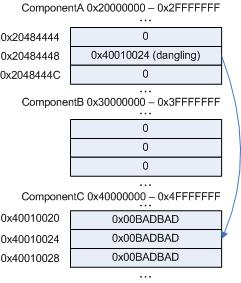
Suppose the pointer p is invalid, dangling, its value has been overwritten and this happened because of some bug. Being invalid that pointer can point to a valid memory location nevertheless and the value it points to most likelyis non-zero. Therefore the body of the “if” statement will be executed.Suppose it always happens when you run the program and every time you executeit the value of the pointer happens to be the same. Here is the picture illustrating the point:

The pointer value 0×40010024 due to some reason always points to the value 0×00BADBAD.Although in the correct program the pointer itself should have had a completely different value and pointed to 0×1,for example, we see that dereferencing its current invalid valuedoesn’t crash the process.

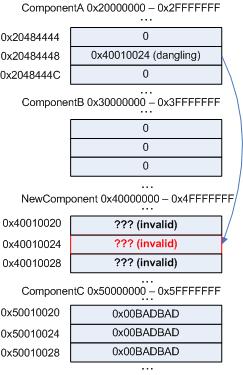
After installingthe new software,NewComponentDLL is loadedatthe address range previously occupied by ComponentC:

Now the address 0×40010024 happens to be completely invalid and we have access violation and the crash dump.

- Dmitry Vostokov -

반응형