반응형
Crash Dump Analysis Patterns (Part 11)


One ofmistakes beginners make is trusting WinDbg !analyze or kv commandsdisplaying stack trace.WinDbg is only a tool, sometimes information necessary to get correct stack trace is missing and therefore some critical thought is required to distinguish between correct and incorrect stack traces. I call this patternIncorrect Stack Trace.Incorrect stack traces usually

  • Have WinDbg warning: “Following frames may be wrong”
  • Don’t have the correct bottomframe like kernel32!BaseThreadStart(in user-mode)
  • Have function calls that don’t make any sense
  • Have strange looking disassembled function code or code that doesn’t make any sense from compiler perspective
  • Have ChildEBP and RetAddr addresses that don’t make any sense

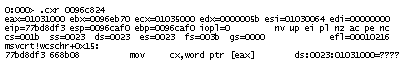
Consider the following stack trace:

0:011> k
ChildEBP RetAddr
WARNING: Frame IP not in any known module. Following frames may be wrong.
0184e434 7c830b10 0×184e5bf
0184e51c 7c81f832 ntdll!RtlGetFullPathName_Ustr+0×15b
0184e5f8 7c83b1dd ntdll!RtlpLowFragHeapAlloc+0xc6a
00099d30 00000000 ntdll!RtlpLowFragHeapFree+0xa7

Here we have almost allattributes of the wrong stack trace. At the first glance it looks like some heap corruption happened (runtime heap alloc and free functions are present) but if you give it second thought you would see that low fragmentation heap Free function shouldn’t call low fragmentation heapAlloc function and the latter shoudn’tquery full path name. That doesn’t make any sense.

What we should do here? Look at raw stack and try to build the correct stack trace ourselves. In our case this is very easy. We need to traverse stack frames from BaseThreadStart+0×34 until we don’t find any function call or reach the top. When functions are called (no optimization, most compilers) EBP registers are linked together as explained on slide 13 here:

Practical Foundations of Debugging (6.1)

0:011> !teb
TEB at 7ffd8000
ExceptionList: 0184ebdc
StackBase: 01850000
StackLimit: 01841000
SubSystemTib: 00000000
FiberData: 00001e00
ArbitraryUserPointer: 00000000
Self: 7ffd8000
EnvironmentPointer: 00000000
ClientId: 0000061c . 00001b60
RpcHandle: 00000000
Tls Storage: 00000000
PEB Address: 7ffdf000
LastErrorValue: 0
LastStatusValue: c0000034
Count Owned Locks: 0
HardErrorMode: 0
0:011> dds 01841000 01850000
01841000 00000000


0184eef0 0184ef0c
0184eef4 7615dff2 localspl!SplDriverEvent+0×21
0184eef8 00bc3e08
0184eefc 00000003
0184ef00 00000001
0184ef04 00000000
0184ef08 0184efb0
0184ef0c 0184ef30
0184ef10 7615f9d0 localspl!PrinterDriverEvent+0×46
0184ef14 00bc3e08
0184ef18 00000003
0184ef1c 00000000
0184ef20 0184efb0
0184ef24 00b852a8
0184ef28 00c3ec58
0184ef2c 00bafcc0
0184ef30 0184f3f8
0184ef34 7614a9b4 localspl!SplAddPrinter+0×5f3
0184ef38 00c3ec58
0184ef3c 00000003
0184ef40 00000000
0184ef44 0184efb0
0184ef48 00c117f8


0184ff28 00000000
0184ff2c 00000000
0184ff30 0184ff84
0184ff34 77c75286 RPCRT4!LRPC_ADDRESS::ReceiveLotsaCalls+0×3a
0184ff38 0184ff4c
0184ff3c 77c75296 RPCRT4!LRPC_ADDRESS::ReceiveLotsaCalls+0×4a
0184ff40 7c82f2fc ntdll!RtlLeaveCriticalSection
0184ff44 000de378
0184ff48 00097df0
0184ff4c 4d2fa200
0184ff50 ffffffff
0184ff54 ca5b1700
0184ff58 ffffffff
0184ff5c 8082d821
0184ff60 0184fe38
0184ff64 00097df0
0184ff68 000000aa
0184ff6c 80020000
0184ff70 0184ff54
0184ff74 80020000
0184ff78 000b0c78
0184ff7c 00a50180
0184ff80 0184fe38
0184ff84 0184ff8c
0184ff88 77c5778f RPCRT4!RecvLotsaCallsWrapper+0xd
0184ff8c 0184ffac
0184ff90 77c5f7dd RPCRT4!BaseCachedThreadRoutine+0×9d
0184ff94 0009c410
0184ff98 00000000
0184ff9c 00000000
0184ffa0 00097df0
0184ffa4 00097df0
0184ffa8 00015f90
0184ffac 0184ffb8
0184ffb0 77c5de88 RPCRT4!ThreadStartRoutine+0×1b
0184ffb4 00088258
0184ffb8 0184ffec
0184ffbc 77e6608b kernel32!BaseThreadStart+0×34
0184ffc0 00097df0
0184ffc4 00000000
0184ffc8 00000000
0184ffcc 00097df0
0184ffd0 8ad84818
0184ffd4 0184ffc4
0184ffd8 8980a700
0184ffdc ffffffff
0184ffe0 77e6b7d0 kernel32!_except_handler3
0184ffe4 77e66098 kernel32!`string’+0×98
0184ffe8 00000000
0184ffec 00000000
0184fff0 00000000
77c5de6d RPCRT4!ThreadStartRoutine
0184fff8 00097df0
0184fffc 00000000
01850000 00000008

Next we need to use custom k command and specify base pointer. In our case the last found stack address that links EBP pointers is 0184eef0:

0:011> k L=0184eef0
ChildEBP RetAddr
WARNING: Frame IP not in any known module. Following frames may be wrong.
0184eef0 7615dff2 0×184e5bf
0184ef0c 7615f9d0 localspl!SplDriverEvent+0×21
0184ef30 7614a9b4 localspl!PrinterDriverEvent+0×46
0184f3f8 761482de localspl!SplAddPrinter+0×5f3
0184f424 74067c8f localspl!LocalAddPrinterEx+0×2e
0184f874 74067b76 SPOOLSS!AddPrinterExW+0×151
0184f890 01007e29 SPOOLSS!AddPrinterW+0×17
0184f8ac 01006ec3 spoolsv!YAddPrinter+0×75
0184f8d0 77c70f3b spoolsv!RpcAddPrinter+0×37
0184f8f8 77ce23f7 RPCRT4!Invoke+0×30
0184fcf8 77ce26ed RPCRT4!NdrStubCall2+0×299
0184fd14 77c709be RPCRT4!NdrServerCall2+0×19
0184fd48 77c7093f RPCRT4!DispatchToStubInCNoAvrf+0×38
0184fd9c 77c70865 RPCRT4!RPC_INTERFACE::DispatchToStubWorker+0×117
0184fdc0 77c734b1 RPCRT4!RPC_INTERFACE::DispatchToStub+0xa3
0184fdfc 77c71bb3 RPCRT4!LRPC_SCALL::DealWithRequestMessage+0×42c
0184fe20 77c75458 RPCRT4!LRPC_ADDRESS::DealWithLRPCRequest+0×127
0184ff84 77c5778f RPCRT4!LRPC_ADDRESS::ReceiveLotsaCalls+0×430
0184ff8c 77c5f7dd RPCRT4!RecvLotsaCallsWrapper+0xd

Stack traces make more sense now but we don’t see BaseThreadStart+0×34. By default WinDbg displays only certain amount of function calls (stack frames) so we need to specify stack frame count, for example, 100:

0:011> k L=0184eef0 100
ChildEBP RetAddr
WARNING: Frame IP not in any known module. Following frames may be wrong.
0184eef0 7615dff2 0×184e5bf
0184ef0c 7615f9d0 localspl!SplDriverEvent+0×21
0184ef30 7614a9b4 localspl!PrinterDriverEvent+0×46
0184f3f8 761482de localspl!SplAddPrinter+0×5f3
0184f424 74067c8f localspl!LocalAddPrinterEx+0×2e
0184f874 74067b76 SPOOLSS!AddPrinterExW+0×151
0184f890 01007e29 SPOOLSS!AddPrinterW+0×17
0184f8ac 01006ec3 spoolsv!YAddPrinter+0×75
0184f8d0 77c70f3b spoolsv!RpcAddPrinter+0×37
0184f8f8 77ce23f7 RPCRT4!Invoke+0×30
0184fcf8 77ce26ed RPCRT4!NdrStubCall2+0×299
0184fd14 77c709be RPCRT4!NdrServerCall2+0×19
0184fd48 77c7093f RPCRT4!DispatchToStubInCNoAvrf+0×38
0184fd9c 77c70865 RPCRT4!RPC_INTERFACE::DispatchToStubWorker+0×117
0184fdc0 77c734b1 RPCRT4!RPC_INTERFACE::DispatchToStub+0xa3
0184fdfc 77c71bb3 RPCRT4!LRPC_SCALL::DealWithRequestMessage+0×42c
0184fe20 77c75458 RPCRT4!LRPC_ADDRESS::DealWithLRPCRequest+0×127
0184ff84 77c5778f RPCRT4!LRPC_ADDRESS::ReceiveLotsaCalls+0×430
0184ff8c 77c5f7dd RPCRT4!RecvLotsaCallsWrapper+0xd
0184ffac 77c5de88 RPCRT4!BaseCachedThreadRoutine+0×9d
0184ffb8 77e6608b RPCRT4!ThreadStartRoutine+0×1b
0184ffec 00000000 kernel32!BaseThreadStart+0×34

Now stack trace looks much better.

- Dmitry Vostokov -

반응형
반응형
Crash Dump Analysis Patterns (Part 9a)

Next pattern is Deadlock. If you don’t know what “deadlock” isread Dumps for Dummes (Part 4).Deadlocksdo not only happenwith synchronization primitives likemutexes, events or more complex objects(builtupon primitives)like critical sectionsor executive resources (ERESOURCE).They canhappen from high level or systems perspectivein inter-process or inter-component communication, for example, mutually waiting on messages: GUI windowmessages, LPC messages, RPC calls. This is a big pattern and I’m going split it into several parts.

How can we seedeadlocks in dumps? Letsstart with user dumps and critical sections.

First I would recommend to read the followingexcellent MSDN articleto understand various membersof CRITICAL_SECTION structure:

Break Free of Code Deadlocks in Critical Sections Under Windows

WinDbg!locks command will examine process critical section listand display all locked critical sections, lock count and thread id of current critical section owner. This is the output froma dump of hanging Windows print spooler process (spoolsv.exe):

0:000> !locks
CritSec NTDLL!LoaderLock+0 at 784B0348
LockCount 4
RecursionCount 1
OwningThread 624
EntryCount 6c3
ContentionCount 6c3
*** Locked

CritSec LOCALSPL!SpoolerSection+0 at 76AB8070
LockCount 3
RecursionCount 1
OwningThread 1c48
EntryCount 646
ContentionCount 646
*** Locked

If we look at threads#624 and #1c48 we could see them mutually waiting for each other:

  • TID#624 owns CritSec 784B0348 and is waiting for CritSec 76AB8070
  • TID#1c48 owns CritSec 76AB8070 and is waiting for CritSec 784B0348

0:000>~*kv

. 12 Id: bc0.624 Suspend: 1 Teb: 7ffd3000 Unfrozen
0000024c 00000000 00000000 NTDLL!ZwWaitForSingleObject+0xb
76ab8000 76a815ef 76ab8070 NTDLL!RtlpWaitForCriticalSection+0×9e
76ab8070 76a844f8 00cd1f38 NTDLL!RtlEnterCriticalSection+0×46
00cd1f38 76a8a1d7 00000000 LOCALSPL!EnterSplSem+0xb
00000000 00000000 00cd1f38 LOCALSPL!FindSpoolerByNameIncRef+0×1f
00000000 777f19bc 00000001 LOCALSPL!LocalGetPrinterDriverDirectory+0xe
00000000 777f19bc 00000001 spoolss!GetPrinterDriverDirectoryW+0×59
00000000 777f19bc 00000001 spoolsv!YGetPrinterDriverDirectory+0×27
00000000 777f19bc 00000001 WINSPOOL!GetPrinterDriverDirectoryW+0×7b
50000000 00000001 00000000 BRHLUI04+0×14ea
50002ea0 50000000 00000001 BRHLUI04!DllGetClassObject+0×1705
00000000 00000000 000cb570 NTDLL!LdrpRunInitializeRoutines+0×1df
000cc8f8 0288ea30 0288ea38 NTDLL!LdrpLoadDll+0×2e6
000cc8f8 0288ea30 0288ea38 NTDLL!LdrLoadDll+0×17)
000c1258 00000000 00000008 KERNEL32!LoadLibraryExW+0×231
000c150c 0288efd8 00000000 UNIDRVUI!PLoadCommonInfo+0×17e
000c150c 0288efd8 00000007 UNIDRVUI!DwDeviceCapabilities+0×1a
00070000 00071378 00000045 UNIDRVUI!DrvDeviceCapabilities+0×19

. 13 Id: bc0.1c48 Suspend: 1 Teb: 7ffd2000 Unfrozen
0000010c 00000000 00000000 NTDLL!ZwWaitForSingleObject+0xb
784b0301 78468d38 784b0348 NTDLL!RtlpWaitForCriticalSection+0×9e
784b0348 74fb4344 00000000 NTDLL!RtlEnterCriticalSection+0×46
74fb0000 02c0f2a8 00000000 NTDLL!LdrpGetProcedureAddress+0×122
74fb0000 02c0f2a8 00000000 NTDLL!LdrGetProcedureAddress+0×17
74fb0000 74fb4344 02c0f449 KERNEL32!GetProcAddress+0×41
017924b0 00000000 00000001 ws2_32!CheckForHookersOrChainers+0×1f
00000101 02c0f344 017924b0 ws2_32!WSAStartup+0×10f
00cdf79c 02c0f4f4 76a8c9bc LOCALSPL!GetDNSMachineName+0×1e
00000000 76a8c9bc 780276a2 LOCALSPL!GetPrinterUrl+0×2c
0176f570 ffffffff 01000000 LOCALSPL!UpdateDsSpoolerKey+0×322
0176f570 76a8c9bc 01792b90 LOCALSPL!RecreateDsKey+0×50
00000000 00000002 01792b90 LOCALSPL!SplAddPrinter+0×521
01791faa 0176a684 76a5cd34 WIN32SPL!InternalAddPrinterConnection+0×1b4
01791faa 02c0fa00 02c0fabc WIN32SPL!AddPrinterConnectionW+0×15
00076f1c 02c0fabc 01006873 spoolss!AddPrinterConnectionW+0×49
00076f1c 00000001 77107fb0 spoolsv!YAddPrinterConnection+0×17
00076f1c 02020202 00000001 spoolsv!RpcAddPrinterConnection+0xb
01006868 02c0fac0 00000001 rpcrt4!Invoke+0×30
00000000 00000000 000d22c8 rpcrt4!NdrStubCall2+0×655
000d22c8 00076fe0 000d22c8 rpcrt4!NdrServerCall2+0×17
010045fc 000d22c8 02c0fe0c rpcrt4!DispatchToStubInC+0×32
0000002b 00000000 02c0fe0c rpcrt4!RPC_INTERFACE::DispatchToStubWorker+0×100
000d22c8 00000000 02c0fe0c rpcrt4!RPC_INTERFACE::DispatchToStub+0×5e
000d3210 00076608 813b0013 rpcrt4!LRPC_SCALL::DealWithRequestMessage+0×1dd
000d21d0 02c0fe50 000d3210 rpcrt4!LRPC_ADDRESS::DealWithLRPCRequest+0×10c
770c9ad0 00076608 770cb6d8 rpcrt4!LRPC_ADDRESS::ReceiveLotsaCalls+0×229
00076608 770cb6d8 0288f9a8 rpcrt4!RecvLotsaCallsWrapper+0×9
00074a50 02c0ffec 77e7438b rpcrt4!BaseCachedThreadRoutine+0×11f
00076e68 770cb6d8 0288f9a8 rpcrt4!ThreadStartRoutine+0×18
770d1c54 00076e68 00000000 KERNEL32!BaseThreadStart+0×52

This analysis looks pretty simple and easy. What about kernel and complete memory dumps?Of course we cannotsee userspace critical sectionsin kernel memory dumps but we can see them in complete memory dumps after switching to appropriate process context and using !ntsdexts.locks. This can be done via simple script adapted from debugger.chm: Deadlocks and Critical Sections

Why it is so easy to see deadlocks when critical sectionsare involved? Because their structures have amember that recordstheir owner. So it is very easy to map them to corresponding threads. The same is with kernel ERESOURCE synchronization objects (we willsee them in the next part). Other objects do not have an owner, for example, in case ofevents it is notso easyto find an ownerjust bylooking at an eventobject. You need to examinethread call stacks, other structures or have access to source code.

- Dmitry Vostokov -

반응형

Crash Dump Analysis Patterns (Part 8)

Crash dump 불펌스페샬 2007. 5. 13. 23:59 posted by CecilDeSK
반응형
Crash Dump Analysis Patterns (Part 8)

Today I will talk about another patternoccurring frequently andI call itHidden Exception. Yourun !analyze -v command and you don’t seeanexception or you see only a breakpoint hit.In thiscase manual analysis is required.This happens sometimes because of another pattern: Multiple Exceptions. In other casesan exception happens and it is handled by an exception handler dismissing it and a process continues execution slowly accumulating corruption inside its data leading to a new crash or hang. Sometimesyou see a process hanging during its termination like the case I present here.

We have a process dumpwith onlyone thread:

0:000> kv
ChildEBP RetAddr
0096fcdc 7c822124 ntdll!KiFastSystemCallRet
0096fce0 77e6baa8 ntdll!NtWaitForSingleObject+0xc
0096fd50 77e6ba12 kernel32!WaitForSingleObjectEx+0xac
0096fd64 67f016ce kernel32!WaitForSingleObject+0x12
0096fd78 7c82257a component!DllInitialize+0xc2
0096fd98 7c8118b0 ntdll!LdrpCallInitRoutine+0x14
0096fe34 77e52fea ntdll!LdrShutdownProcess+0x130
0096ff20 77e5304d kernel32!_ExitProcess+0x43
0096ff34 77bcade4 kernel32!ExitProcess+0x14
0096ff40 77bcaefb msvcrt!__crtExitProcess+0x32
0096ff70 77bcaf6d msvcrt!_cinit+0xd2
0096ff84 77bcb555 msvcrt!_exit+0x11
0096ffb8 77e66063 msvcrt!_endthreadex+0xc8
0096ffec 00000000 kernel32!BaseThreadStart+0x34

We can look at its raw stack and try to find the following address:

KiUserExceptionDispatcher

This functioncalls RtlDispatchException:

0:000> !teb
TEB at 7ffdc000
ExceptionList: 0096fd40
StackBase: 00970000
StackLimit: 0096a000
SubSystemTib: 00000000
FiberData: 00001e00
ArbitraryUserPointer: 00000000
Self: 7ffdc000
EnvironmentPointer: 00000000
ClientId: 00000858 . 000008c0
RpcHandle: 00000000
Tls Storage: 00000000
PEB Address: 7ffdd000
LastErrorValue: 0
LastStatusValue: c0000135
Count Owned Locks: 0
HardErrorMode: 0

0:000>dds 0096a000 00970000
...
...
...
0096c770 7c8140cc ntdll!RtlDispatchException+0x91
0096c774 0096c808
0096c778 0096ffa8
0096c77c 0096c824
0096c780 0096c7e4
0096c784 77bc6c74 msvcrt!_except_handler3
0096c788 00000000
0096c78c 0096c808
0096c790 01030064
0096c794 00000000
0096c798 00000000
0096c79c 00000000
0096c7a0 00000000
0096c7a4 00000000
0096c7a8 00000000
0096c7ac 00000000
0096c7b0 00000000
0096c7b4 00000000
0096c7b8 00000000
0096c7bc 00000000
0096c7c0 00000000
0096c7c4 00000000
0096c7c8 00000000
0096c7cc 00000000
0096c7d0 00000000
0096c7d4 00000000
0096c7d8 00000000
0096c7dc 00000000
0096c7e0 00000000
0096c7e4 00000000
0096c7e8 00970000
0096c7ec 00000000
0096c7f0 0096caf0
0096c7f4 7c82ecc6 ntdll!KiUserExceptionDispatcher+0xe
0096c7f8 0096c000
0096c7fc 0096c824 ; a pointer to an exception context
0096c800 0096c808
0096c804 0096c824
0096c808 c0000005
0096c80c 00000000
0096c810 00000000
0096c814 77bd8df3 msvcrt!wcschr+0×15
0096c818 00000002
0096c81c 00000000
0096c820 01031000
0096c824 0001003f
0096c828 00000000
0096c82c 00000000
0096c830 00000000
0096c834 00000000
0096c838 00000000
0096c83c 00000000

A second parameter to both functions is a pointer to a so called exception context (processor state when an exception occurred). We can use .cxr command to change thread execution context to what it was at the time of exception:

Afterchanging the contextwe can see thread stack prior to that exception:

0:000> kL
ChildEBP RetAddr
0096caf0 67b11808 msvcrt!wcschr+0×15
0096cb10 67b1194d component2!function1+0×50
0096cb24 67b11afb component2!function2+0×1a
0096eb5c 67b11e10 component2!function3+0×39
0096ed94 67b14426 component2!function4+0×155
0096fdc0 67b164b7 component2!function5+0×3b
0096fdcc 00402831 component2!function6+0×5b
0096feec 0096ff14 program!function+0×1d1
0096ffec 00000000 kernel32!BaseThreadStart+0×34

We seethat the exception happened when component2 was searchinga Unicode string fora character (wcschr).Most likely the string was not zero terminated:

To summarize andshow youthe commonexception handling pathin user space here is another thread stack taken froma different dump:

ntdll!KiFastSystemCallRet
ntdll!NtWaitForMultipleObjects+0xc
kernel32!UnhandledExceptionFilter+0×746
kernel32!_except_handler3+0×61
ntdll!ExecuteHandler2+0×26
ntdll!ExecuteHandler+0×24
ntdll!RtlDispatchException+0×91
ntdll!KiUserExceptionDispatcher+0xe
ntdll!RtlpCoalesceFreeBlocks+0×36e ; crash is here
ntdll!RtlFreeHeap+0×38e
msvcrt!free+0xc3
msvcrt!_freefls+0×124
msvcrt!_freeptd+0×27
msvcrt!__CRTDLL_INIT+0×1da
ntdll!LdrpCallInitRoutine+0×14
ntdll!LdrShutdownThread+0xd2
kernel32!ExitThread+0×2f
kernel32!BaseThreadStart+0×39

When RtlpCoalesceFreeBlocks(this function compacts heap and it is called from RtlFreeHeap)does an illegal memory access then this exception is first processed in kernel and becauseit happened in user space and mode the execution is transferred to RtlDispatchException which searches for exception handler and in this case there is a default one installed: UnhandledExceptionFilter.

If you see this function on call stack you can alsomanually get an exception context and a thread stackleading to it like in this example below taken fromother dump:

The most likely reasonofthis crashisan instance of Dynamic Memory Corruptionpattern - heap corruption.

- Dmitry Vostokov -

반응형

Crash Dump Analysis Patterns (Part 6)

Crash dump 불펌스페샬 2007. 5. 13. 23:58 posted by CecilDeSK
반응형
Crash Dump Analysis Patterns (Part 6)

Now it’s time to“introduce” Invalid Pointer pattern. It’s just a number saved in a register orin a memory location and when we try to interpret it as a memory address itself and follow it (dereference) to fetch memory contents(value) it points to, OS with the help of hardware tells us that the address doesn’t exist or inaccessible due to security restrictions. The following two slides from my old presentation depict the concept of a pointer:

Pointer definition
Pointers depicted

In Windows you have your process memory partitioned into two big regions: kernel space and process space. Space partition isa differentconcept than execution mode (kernel or user, ring 0 or ring 3) whichis a processor state.Code executing in kernel mode (a driver or OS, for example) can access memory that belongs to user space.

Based on this we can make distinction between invalid pointers containing kernel space addresses (start from0×80000000 on x86, no /3Gb switch) and invalid pointers containing user space addresses (below0×7FFFFFFF).

On Windows x64user spaceaddressesarebelow0×0000070000000000 and kernel spaceaddresses start from0xFFFF080000000000.

When you dereference invalid kernel space address you get bug check immediately:

UNEXPECTED_KERNEL_MODE_TRAP (7f)

PAGE_FAULT_IN_NONPAGED_AREA (50)

There is no way you can catch it in your code (by using SEH).

However when you dereference userspace address the course of action depends on whether your processor is in kernel mode (ring 0) or in user mode (ring 3). In any mode you can catch the exception(by using appropriate SEH handler) or leave this to the operating system or debugger. If there was no componentwilling to process the exceptionwhen it happened in user mode you get your process crash and in kernel mode you getbug checks:

SYSTEM_THREAD_EXCEPTION_NOT_HANDLED (7e)

KERNEL_MODE_EXCEPTION_NOT_HANDLED (8e)

I summarized all of thison thefollowing diagram:

pointers.JPG

NULL pointer is a special class of user space pointers. Usually its value is in the range of 0×00000000 - 0×0000FFFF.You can see themused in instructions like

mov esi, dword ptr [ecx+0×10]

and ecxvalue is0×00000000 so you try to access the value located at 0×00000010 memory address.

When you get a crash dump and you see an invalid pointer patternthe next step is to interpretthe pointer valuewhichshould help in understanding possible steps that led to the crash. Pointer value interpretation is the subject of the next part.

- Dmitry Vostokov -

반응형