'전체 글'에 해당되는 글 274건

  1. 2007.05.13 Crash Dumps for Dummies (Part 4)
  2. 2007.05.13 Crash Dumps for Dummies (Part5) 3
  3. 2007.05.13 Crash Dumps for Dummies (Part 3)
  4. 2007.05.13 Crash Dumps for Dummies (Part 1)

Crash Dumps for Dummies (Part 4)

Crash dump 불펌스페샬 2007. 5. 13. 23:46 posted by CecilDeSK
반응형
Crash Dumps for Dummies (Part 4)

In the previous Dumps for Dummies (Part 3)I tried to explain the nature of crashes. Another category of problems happens very often and we also need a dump for analysis: hangs. There issome confusion exists in understanding the difference between these two categories:crash andhang. Although sometimes a hang is a direct consequence of a crash most of the time hangs happen independently. They also manifest themselves differently. Lets look at application (process) crashes and hangs first. When a crash happensan application (process) often disappears. When hang happensan application (process)is still in memory: you can see it in Task Manager, for example,but it doesn’t respond to user commands or to any other requests like pinginga TCP/IP port. If we have a crash in OS then the most visible manifestation is blue screen and/or reboot. If we have a hang then everything freezes.

Application or system hang happens because from high levelview of the interaction betweenapplication or OS components (modules)is done via messages. One component sends a message to another and waits for a response.Some components are critical, for example, registry. The following hand-made picturedepicts very commonsystem hang situationswhen the register component stops responding. Then every running application (process) stops respondingif its execution path depends on registry access.

crit_component.JPG

The very common reason for hang is so called deadlock when two running applications (their execution paths, threads) are waiting for each other. Here is the analogy witha blocked road:

deadlock.JPG

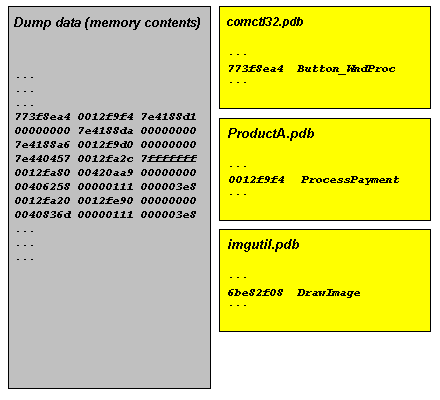
In order to see what’s inside the process or OS which causeda hang we need a dump. Usually this dumpiscalled a crash dump too because in order to get it the usual method is to make some sort of a trap which causesanapplication or OS to crash and to save the dump. I personally prefer to callthese dumps just memory dumps to avoid confusion.

How can you get a memory dump if your application or service hangs?

How can you get a memory dumpif yoursystem hangs?

For most system hangs choosing Kernel memory dump option in Control PanelSystemAdvancedStartup and Recovery applet is sufficient. Kernel memory dumps are smaller and less susceptible to corruption or truncation due tosmall page file size. If you discover that you need to peer inside running user applications then you can always ask for another Complete memory dump when the problem happens again.

- DmitryVostokov -

반응형

Crash Dumps for Dummies (Part5)

Crash dump 불펌스페샬 2007. 5. 13. 23:46 posted by CecilDeSK
반응형
Crash Dumps for Dummies (Part5)

In this part,I try to explain symbol files.They are usually called PDB filesbecause they have .PDB extension although the older onescan have .DBG extension. PDB files are needed to read dump files properly. Without PDB files the dump file data is just acollection of numbers, the contents of memory,without any meaning. PDBfiles help tools like WinDbg tointerpret the data and present it in a human-readable format.Roughly speaking, PDB filescontainassociations between numbers and their meanings expressed inshort text strings:

Because these associationsare changedwhen youhave a fix or a service pack on a computer and you have a dump from it you need newer PDB files that correspond to updated components such as DLLs or drivers.

Long time ago you had to download symbol filesmanually from Microsoft or get them from CDs. Now Microsoft hasits dedicated internet symbol server and WinDbg can downloadPDB files automatically.However you need to specify Microsoft symbol server locationin FileSymbol File Path… dialog and check Reload.The locationis usually:

SRV*c:websymbols*http://msdl.microsoft.com/download/symbols

If you don’t rememberthelocation when you run WinDbg for the first time or on a new computer you can enter .symfix command tosetMicrosoft symbol serverpath automatically and specifythe location where to download symbol files.You can check your current symbol search pathbyusing .sympathcommand and don’t forget to reload symbols by entering .reload command:

0:000> .symfix
No downstream store given, using C:Program FilesDebugging Tools for Windowssym
0:000> .sympath
Symbol search path is: SRV**http://msdl.microsoft.com/download/symbols
0:000> .symfix c:websymbols
0:000> .sympath
Symbol search path is: SRV*c:websymbols*http://msdl.microsoft.com/download/symbols
0:000> .reload

- Dmitry Vostokov -

반응형

Crash Dumps for Dummies (Part 3)

Crash dump 불펌스페샬 2007. 5. 13. 23:44 posted by CecilDeSK
반응형

This part follows Dumps for Dummies (Part 2)and hereI’ll try to explaincrashes, dumps and postmortem debuggers.

Sometimes a computer(CPU, Central Processing Unit) cannot perform its job because the instruction it gets to dosome calculations, read or write data iswrong. Imagine a situation when you get an address to deliver a message to and youfind that it doesn’t exist…The following idealized picture shows this situation (if memory locations/addresses are indexed from 0 then -1 is obviously wrong address):

crashexplained2.JPG

When referencing invalid addressCPUexecutesspecial sequence of actions (called trap) that ultimately leads tosavingmemory so you could later examine its contents and find outwhich instruction was invalid. If crash happens inside Windows operating system then you see blue screenand then a kernel memory orfull computer physicalmemory is saved in a file (called either kernel or complete memory dump respectively). If you have a crash in a running application or service thenits memorycontents are saved in a file (called user dump). The latterfile is also calleda postmortemdump andwe calla program which savesit a postmortem debugger. There can be several such programs and the one which is specified in the registry toexecute whenever a crash happens in a running application or service is calleda default postmortem debugger. The following pictureillustrates this (here spooler service, spoolsv.exe, crashedby faulty printer driver):

postmortemdumps2.JPG

By default it is Dr. Watson (drwtsn32.exe) but sometimes it doesn’t work in terminal services environment and haslimitations so we always recommend setting NTSD (ntsd.exe) as a default postmortem debugger:

How to Set NTSD as a Default Windows Postmortem Debugger

Iprefer to call both user and kernel/complete memory dumps postmortem (not only user dumps) because they are saved after application, service or systemis dead already (crash or fatal error already happened). This distinguishes them from live memory dumpssaved manually whenever we want them.This brings us to dump classification that I show you inforthcoming parts.

- Dmitry Vostokov -

반응형

Crash Dumps for Dummies (Part 1)

Crash dump 불펌스페샬 2007. 5. 13. 23:43 posted by CecilDeSK
반응형
Crash Dumps for Dummies (Part 1)

There is much confusion amongMS and therefore Citrix customers about different dump types - Windows has 3 major dump types (not including various mini-dumps): complete, kernel and user. Long time ago I created a hand-crafted picture showing how various parts of computer memory are saved in a dump and I want to share it with a wider part of Citrix community and perhaps with the rest of the world:

dumps3.JPG

- Dmitry Vostokov -

반응형